CHART PATTERN : THE REVERSAL PATTERN
Hadi adalah penasihat perdagangan di pasar berjangka sebagai pedagang valas dan komoditas. Sebagai seorang trader scalper, Dia menggunakan strategi Trendline dan Indikator Aligator untuk trading. Dia akan membantu Anda mempelajari cara menghasilkan uang dari 'zero' menjadi 'hero'.

Reversal Chart Patterns are those chart formations that signal that the ongoing trend is about to change course. If a reversal chart pattern forms during an uptrend, it hints that the trend will reverse and that the price will head down soon. Conversely, if a reversal chart pattern is seen during a downtrend, it suggests that the price will move up later on.
In this lesson, we covered six chart patterns that give reversal signals. I will explained bellow with the definiton:
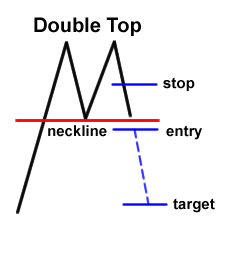
Double Top: A double top is a reversal pattern that is formed after there is an extended move up. The “tops” are peaks which are formed when the price hits a certain level that can't be broken. After hitting this level, the price will bounce off it slightly, but then return back to test the level again.
Double Bottom: The Double Bottom Reversal is a bullish reversal pattern typically found on bar charts, line charts, and candlestick charts. As its name implies, the pattern is made up of two consecutive troughs that are roughly equal, with a moderate peak in-between.
The Pictures Explanation Will be Mentioned Below
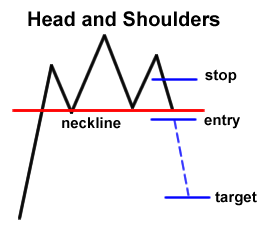
Head and Shoulders: On the technical analysis chart, the Head and shoulders formation occurs when a market trend is in the process of reversal either from a bullish or bearish trend; a characteristic pattern takes shape and is recognized as reversal formation.
Inverse Head and Shoulders: The head and shoulders pattern works as a reversal pattern that signals the end of a downtrend. As the price progresses downward, it hits a low point and then pulls back to the upside. The price then drops to a lower low and pulls back again.
The Pictures Explanation Will be Mentioned Below
Rising Wedge: The Rising Wedge is a bearish pattern that begins wide at the bottom and contracts as prices move higher and the trading range narrows. In contrast to symmetrical triangels, which have no definitive slope and no bullish or bearish bias, rising wedges definitely slope up and have a bearish bias.
Falling Wedge: The Falling wedge pattern is characterized by a chart pattern which forms when the market makes lower lows and lower highs with a contracting range. When this pattern is found in a downward trend, it is considered a reversal pattern, as the contraction of the range indicates the downtrend is losing steam.
The Pictures Explanation Will be Mentioned Below
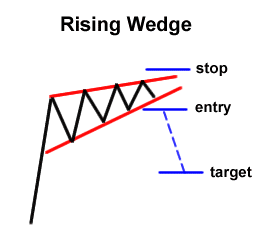
To trade these chart patterns, simply place an order beyond the neckline and in the direction of the new trend. Then go for a target that’s almost the same as the height of the formation. For instance, if you see a double bottom, place a long order at the top of the formation’s neckline and go for a target that’s just as high as the distance from the bottoms to the neckline.
In the interest of proper risk management, don’t forget to place your stops! A reasonable stop loss can be set around the middle of the chart formation. For example, you can measure the distance of the double bottoms from the neckline, divide that by two, and use that as the size of your stop.
RECOMMENDATION FROM EXPERT :
- Jadi, diharapkan artikel ini dapat memberikan kemudahan anda dalam trading. Temukan informasi mengenai analisa fundamental dan teknikal yang lain yang mudah dan cocok untuk anda dalam segala kondisi market.
- Share artikel ini ke temanmu dan DAPATKAN FREE KONSULTASI TRADING ini langsung dengan Saya untuk memaksimalkan profit anda.
- CALL atau whatsapp dan cari HADI silahkan hubungi di SINI
Artikel Terkait


TRADING BLOG
- JURUS TEKNIKAL
- JURUS FUNDAMENTAL
- PSIKOLOGI & MINDSET
- MONEY MANAGEMENT
- TIPS & TRICK TRADING
- STRATEGI TRADING
- PERANGKAT PEMBANTU
- FOREX FOR FUN
- SEPUTAR FOREX
- BERITA
BERITA POPULER
